可视化大屏地图就是一种将数据以生动、直观的方式呈现的工具,它可以让数据更加生动,更加具有说服力,从而让人们更容易地理解和分析数据。在许多领域,例如市政管理、物流、环境保护等,都有广泛的应用。因此,本次文章我们通过ThreeJs进行三维地图的制作。通过本文章学会之后可以将学到的内容进行组件封装从而可以生成任意省份的三维地图,并且在此三维地图的基础上可以进行样式的自定义以及添加飞线、涟漪等的扩展.
制作过程
首先我们需要下载ThreeJs以及d3插件
 npm install three
 npm install d3
创建div用来显示三维图形
 <div id="webgl-out">
 </div>
下面我们需要对一些内容进行初始化
渲染器初始化(将场景通过canvas渲染到html中,我们渲染的范围大小为div的宽度和高度,如果想将其适应窗口拖动大小,可以使用窗口监听的方法,并在窗口变化时执行这个方法)
 const initRenderer=()=>{
  renderer = new THREE.WebGLRenderer()
   renderer.setSize(document.getElementById('webgl-out').clientWidth, document.getElementById('webgl-out').clientHeight)
   document.getElementById('webgl-out').appendChild(renderer.domElement)
 }
场景初始化
 const initScene=()=>{
   scene = new THREE.Scene()
 }
相机初始化
 const initCamera=()=>{
   camera = new THREE.PerspectiveCamera(45, document.getElementById('webgl-out').clientWidth / document.getElementById('webgl-out').clientHeight, 0.1, 1000)
   camera.position.set(50, 50, 50)
   camera.lookAt(scene.position)
 }
场景渲染初始化
 const animate=()=>{
   renderer.render(scene,camera)
 }
当我们将这些东西初始化,并运行之后会得到一下界面,我们可以看到界面黑漆漆的一片

下面我们为场景添加辅助线,通过辅助线我们可以更好的对坐标点进行定位,通过加入辅助线,我们可以看到,辅助线的中心点就是(0,0,0)点坐标
 const initHelp=()=>{
   let axes=new THREE.AxesHelper(1000)
   scene.add(axes)
 }
添加轨道控制器
当我们添加完坐标辅助线之后我们将进行轨道控制器的添加,通过使用轨道控制器我们可以对场景进行缩放旋转等的操作,可以更好的对模型进行观察。如图所示,通过轨道控制器我们可以对场景进行旋转。
 let orbitControls
 const initControls=()=>{
   orbitControls = new OrbitControls(camera, renderer.domElement)
 }
下载地图数据
下面我们去网站下载地图数据
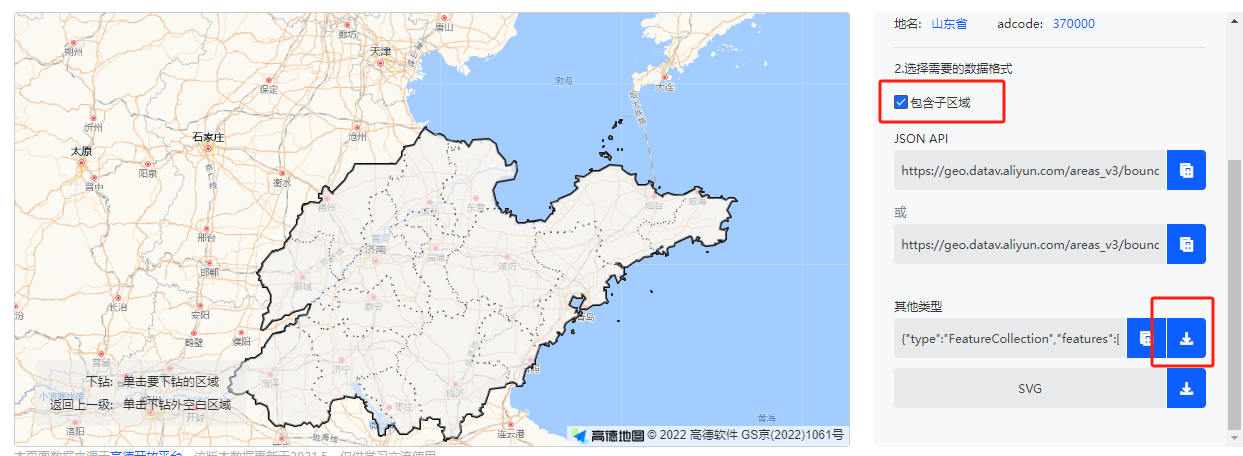
我们需要下载两份地图数据,一份为包含子区域的数据,一份为不包含子区域的数据,不包含子区域的数据用来生成地图轮廓,包含子区域的数据用来生成地图区域,以及地图标签。
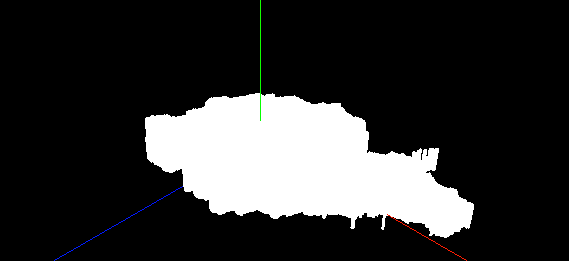
生成地图轮廓
通过以下代码我们可以生成地图的轮廓,如下图所示,注意我们在生成地图轮廓的时候使用的是不包含子区域的数据
 const initMap=(shandongout)=>{
   const material=new THREE.MeshBasicMaterial({
     color: 0x113c76,
     transparent: true,
     opacity: 0.7
   })
   shandongout.features.forEach(elem=>{
     const province = new THREE.Object3D()
     let {coordinates}=elem.geometry
     coordinates.forEach(multPolygon=>{
       multPolygon.forEach(polygon=>{
         const shape=new THREE.Shape()
         for(let i=0;i<polygon.length;i++){
           let [x,y]=projectpos(polygon[i])
           if (!isNaN(x)) {
             shape.moveTo(x, -y)
           }
           shape.lineTo(x, -y)
         }
         const extrudsSettings = {
             depth: 2
         }
         const geometry = new THREE.ExtrudeGeometry(shape, extrudsSettings)
         const mesh = new THREE.Mesh(geometry, material)
         mesh.rotateX(-Math.PI / 2)//翻转一下
         province.add(mesh)
       })
     })
     map.add(province)
   })
   scene.add(map)
 }
对地图轮廓进行样式的修改,通过对样式进行修改,可以得到以下样式,使其更符合开发时使用的主题样式
 const material=new THREE.MeshBasicMaterial({
     color: 0x113c76,
     transparent: true,
     opacity: 0.7
   })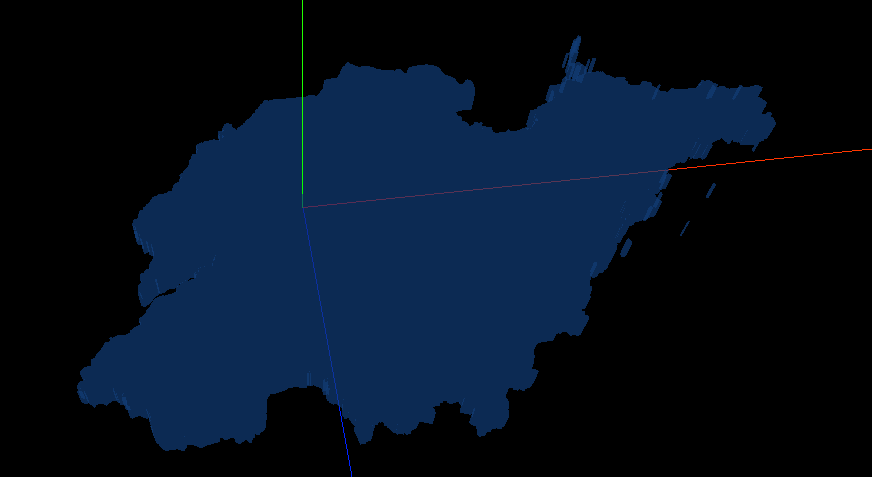
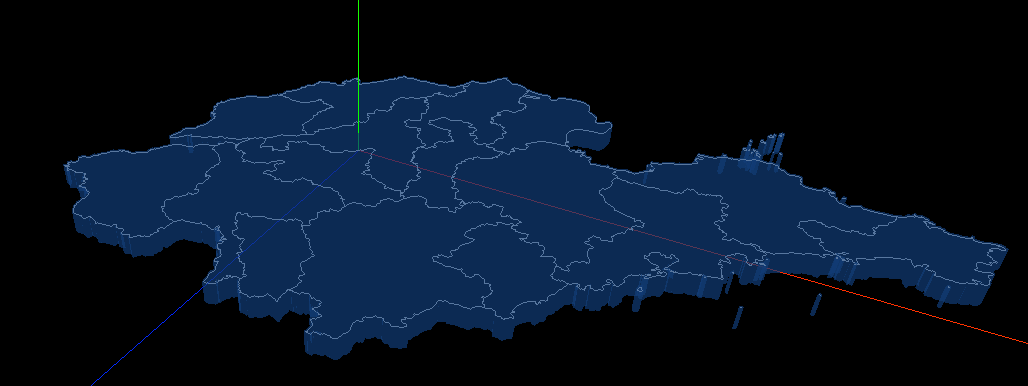
生成地图轮廓线
我们使用包含子区域的数据生成地图轮廓,并将其添加至场景中,就是将地图数据生成现况模型覆盖到不包含子区域生成的地图模型中
 const initMapLine=(shandong) =>{
   shandong.features.forEach(elem=>{
     const province = new THREE.Object3D()
     let {coordinates}=elem.geometry
     initText(elem.properties)
     coordinates.forEach(multPolygon => {
         multPolygon.forEach(polygon => {
             const lineMaterial = new THREE.LineBasicMaterial({
                 color: 'white'
             })
             const lineGeometry = new THREE.BufferGeometry()
             let pointerArr = []
             for (let i = 0; i < polygon.length; i++) {
                 let [x, y] = projectpos(polygon[i])
                 if (!isNaN(x)) {
                     pointerArr.push(x, -y, 2.01)
                 }
             }
             lineGeometry.setAttribute('position', new THREE.Float32BufferAttribute(pointerArr, 3))
             const line = new THREE.Line(lineGeometry, lineMaterial)
             line.rotateX(-Math.PI / 2)
             province.add(line)
         })
     })
     map.add(province)
   })
 }
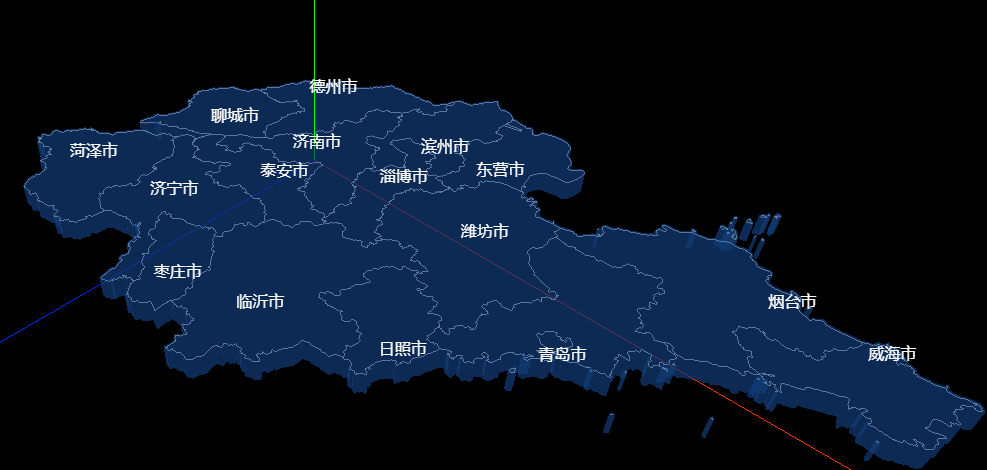
添加标签
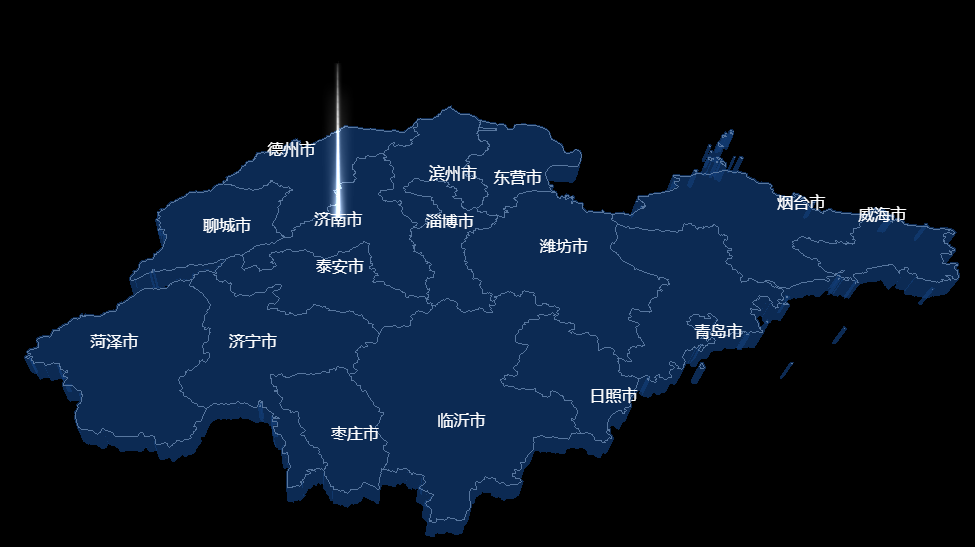
通过CSS2D以及包含子区域的地图数据,我们对地图添加标签,添加标签之后如下图所示
 //生成标签点
 const initText=(properties)=> {
     let center = properties.center || properties.centroid
     const [x, y] = projectpos(center)
     let tag = document.createElement('div')
     tag.innerHTML = properties.name
     tag.style.color = '#fff'
     tag.style.position = 'absolute'
     let label = new CSS2DObject(tag)
     label.element.style.visibility = 'visible'
     label.position.set(x, 2.1, y)
     scene.add(label)
 }
添加光柱效果
最后我们对地图进行小小的扩展,对地图的中心点,济南添加一个光柱效果,就是在这个点添加一个地面模型交叉,然后进行贴图,涟漪效果等亦是如此。如果希望更炫酷的话可以使用gsap补间动画。
 if(properties.name=='济南市'){
       // 实现光柱
       let lightPillarTexture = new THREE.TextureLoader().load(
         "./images/light_column.png"
       );
       let lightPillarGeometry = new THREE.PlaneGeometry(3, 20);
       let lightPillarMaterial = new THREE.MeshBasicMaterial({
         color: 0xffffff,
         map: lightPillarTexture,
         alphaMap: lightPillarTexture,
         transparent: true,
         blending: THREE.AdditiveBlending,
         side: THREE.DoubleSide,
         depthWrite: false,
       });
       let lightPillar = new THREE.Mesh(lightPillarGeometry, lightPillarMaterial);
       lightPillar.add(lightPillar.clone().rotateY(Math.PI / 2));
       lightPillar.position.set(x, 10, y)
       scene.add(lightPillar)
     }